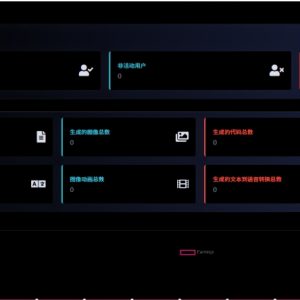
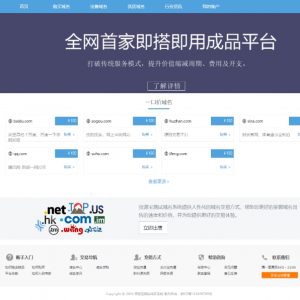
Explore a series of carefully designed web templates specifically created for big data visualization and electronic sand table display. These templates are developed based on HTML, CSS and JavaScript and are designed to provide customized data presentation solutions for different industries, including but not limited to:
Smart government: Demonstrate the intelligent management of government activities and public services through data visualization.
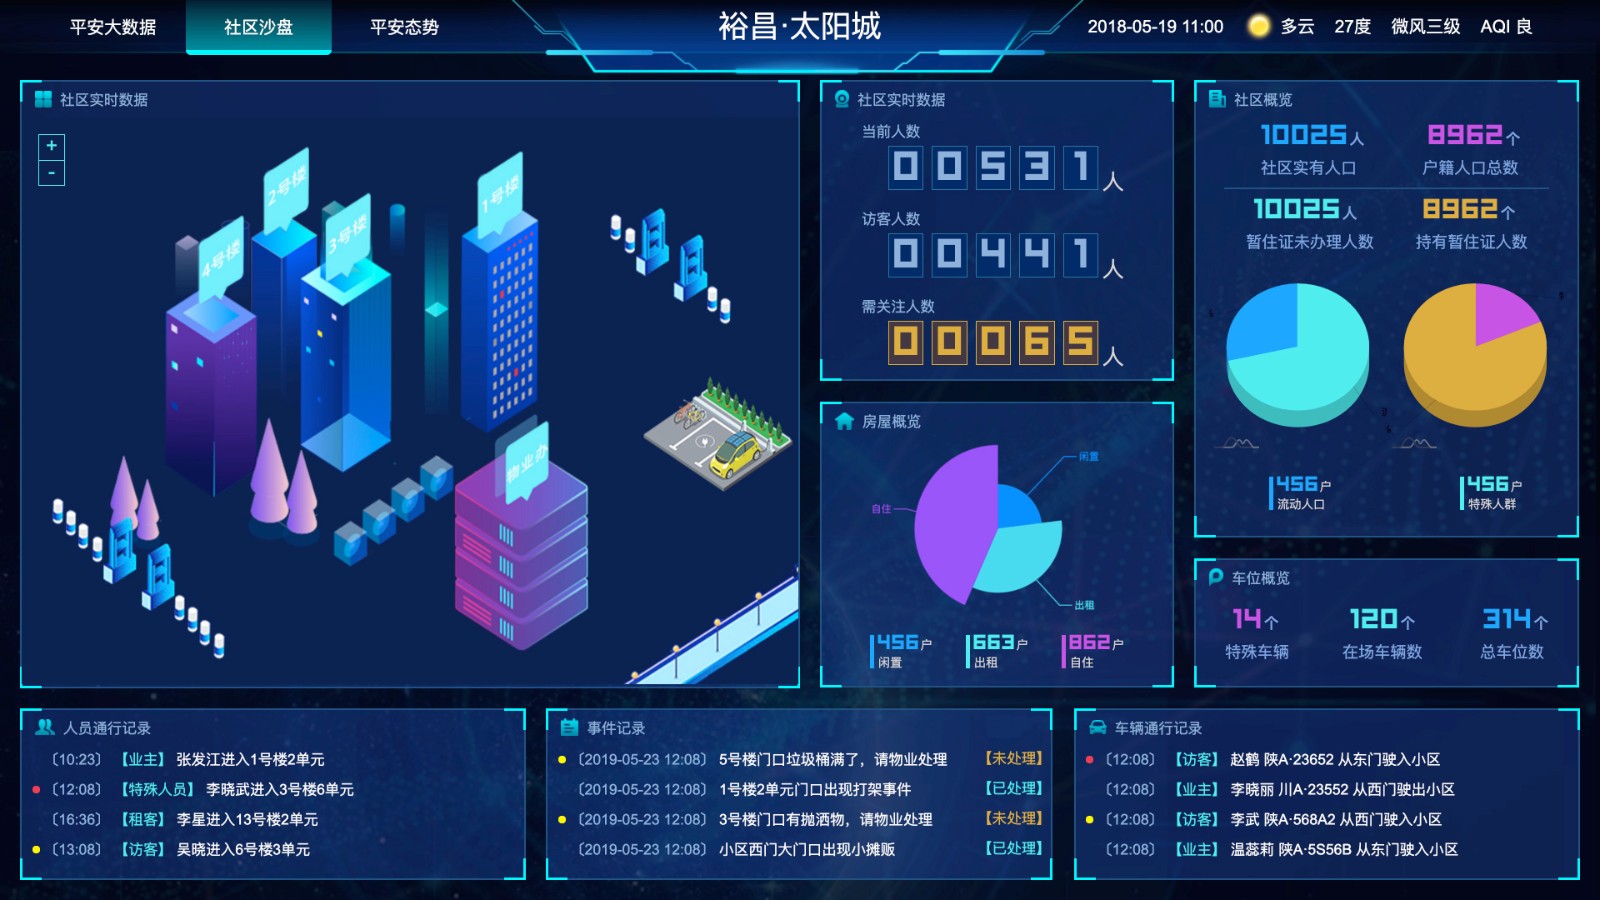
Smart community: Use big data technology to optimize community management and services and improve residents 'quality of life.
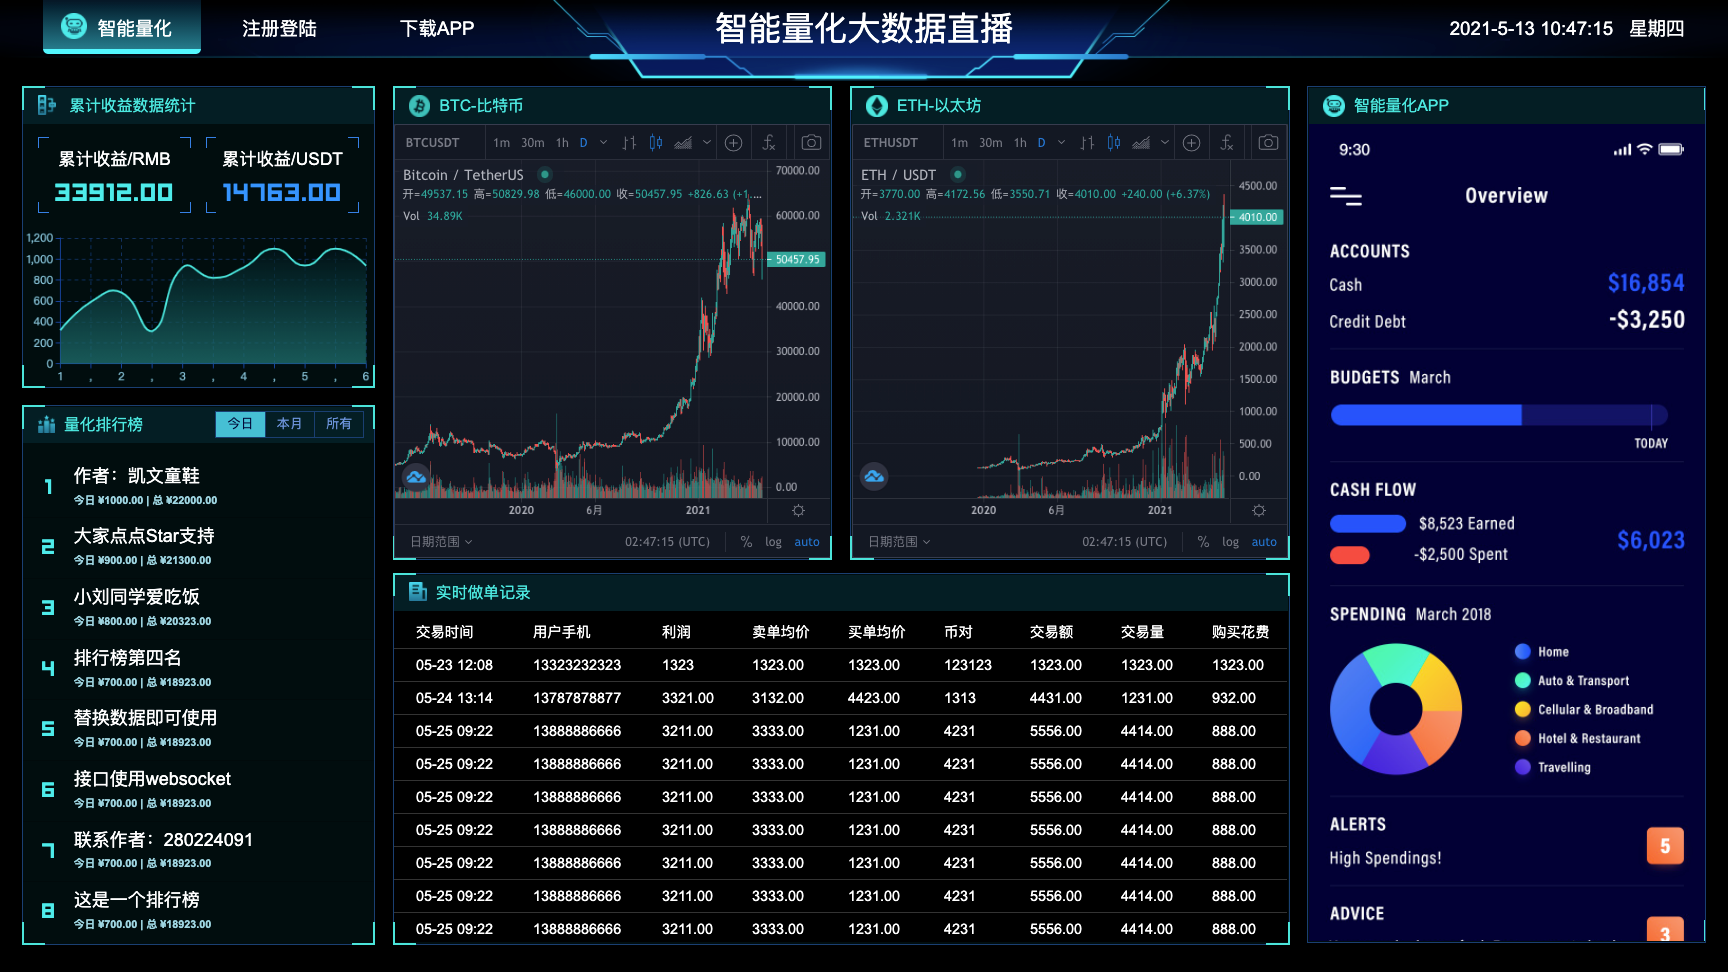
Financial Industry: Display real-time financial data, market dynamics and investment analysis.
Smart transportation: Dynamically display traffic flow and road condition information to optimize traffic management and travel experience.
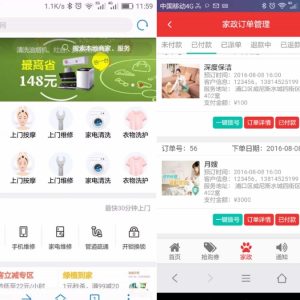
Smart stores: Optimize retail management through data analysis and improve customer shopping experience.
Smart Hall: Improve information management in public service areas and provide more efficient services.
Smart Logistics: Use big data to optimize logistics distribution paths and improve logistics efficiency.
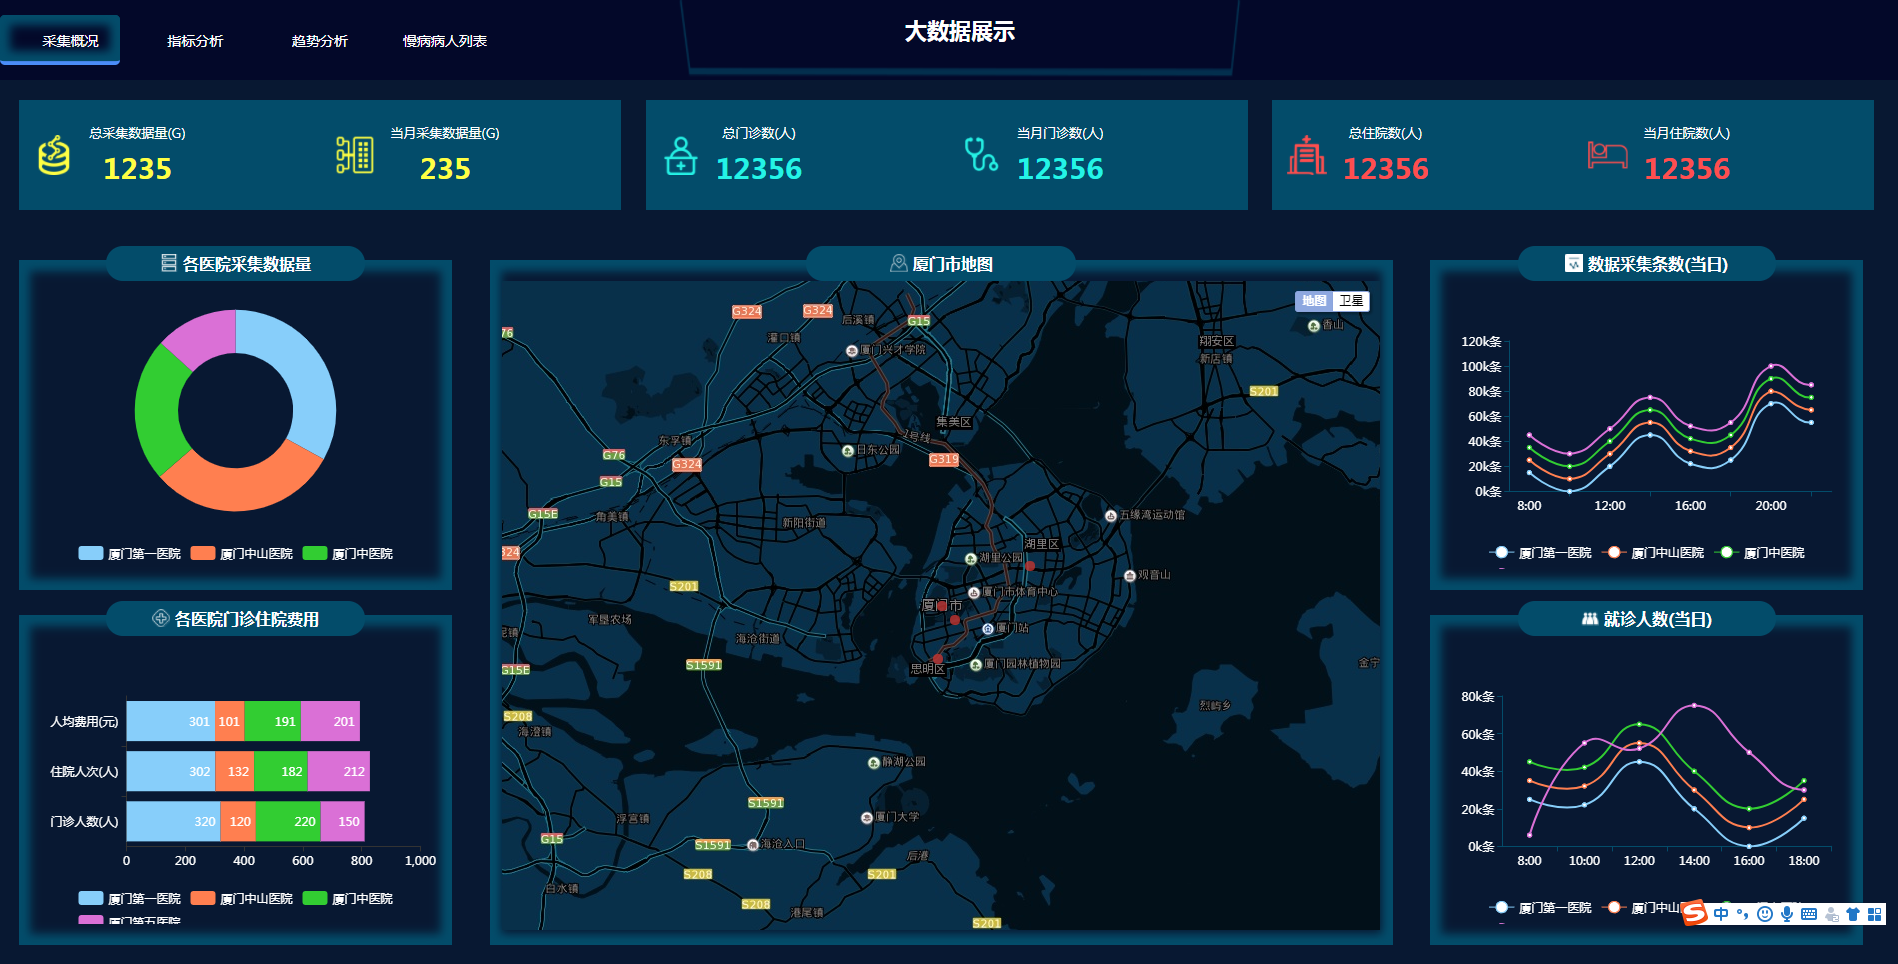
Smart medical care: Improve the quality and efficiency of medical services through data analysis.
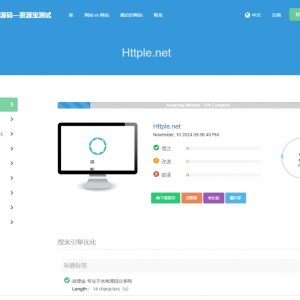
Universal template: A big data analysis and display platform suitable for multiple scenarios.
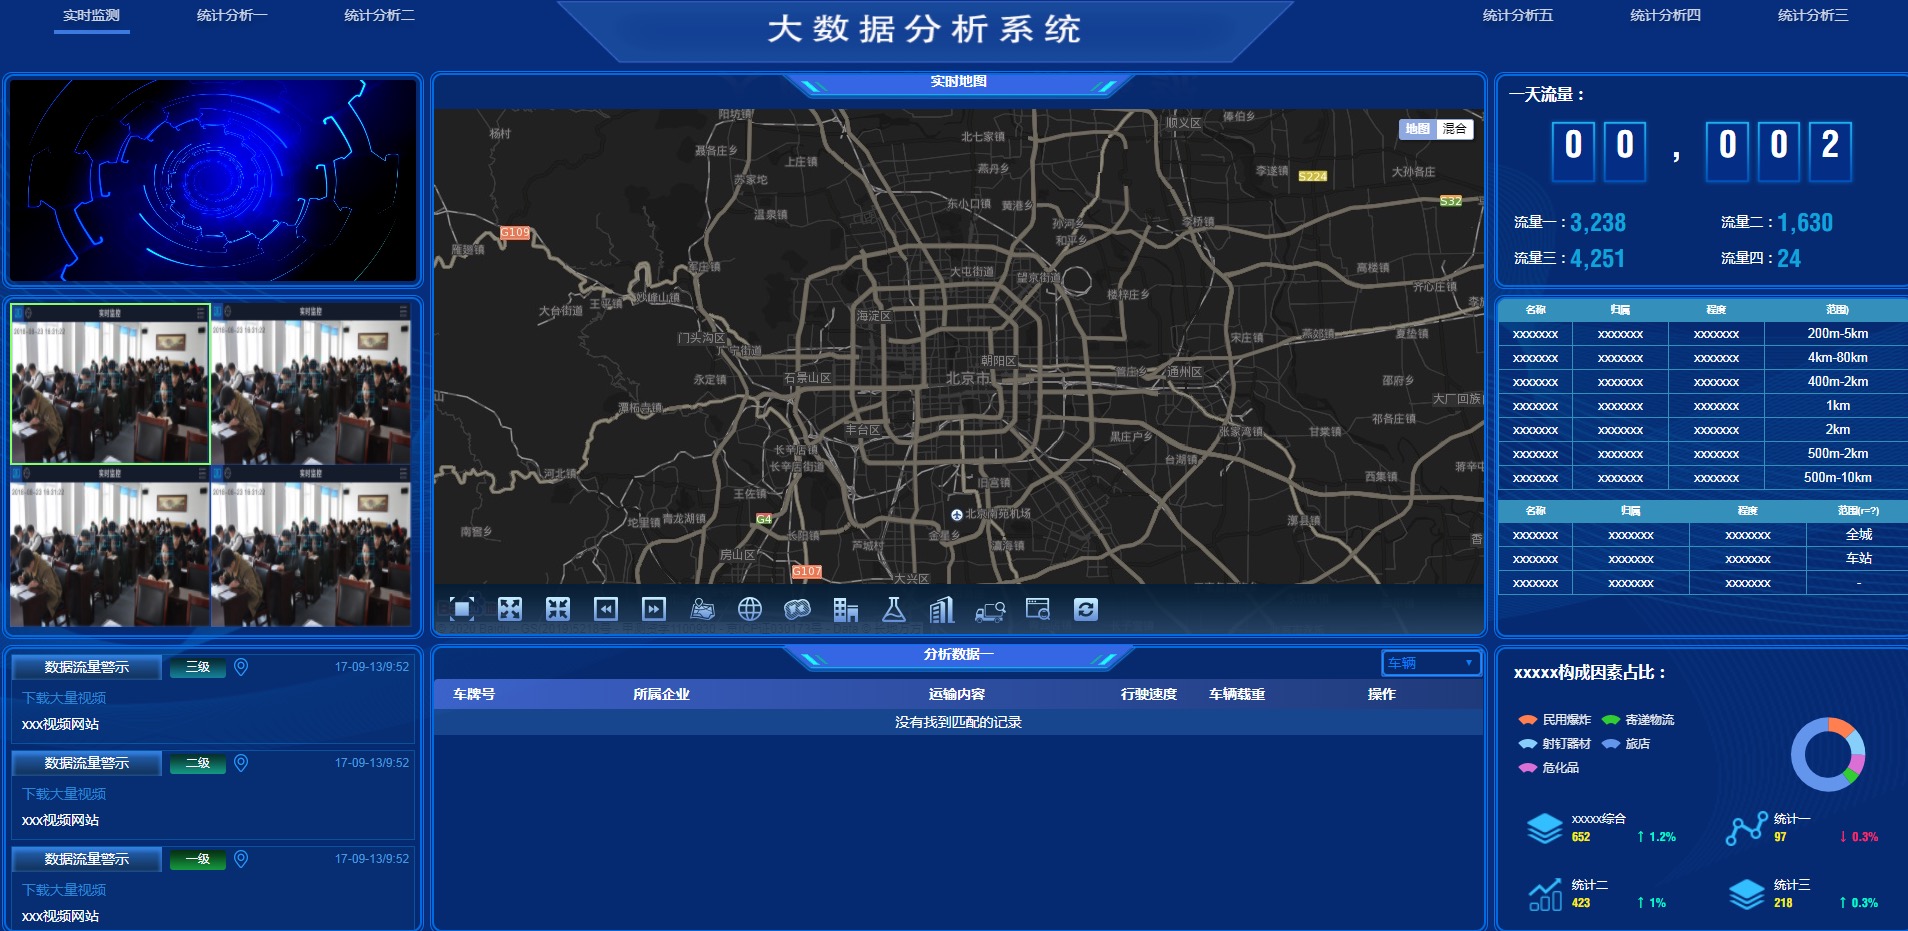
Big data analysis platform: In-depth data analysis and visual display for specific industries.
Project functional highlights (some):
Real-time data K-line chart: Supports multiple industry models and can be freely configured as needed to display key business indicators in real time.
Switchable large-screen display: Flexibility to switch between different data views and reports to adapt to the display needs of multiple scenarios.
Flop effect: Dynamically update display data in the form of flop to enhance the visual effect of information transmission.
Custom fonts: Support custom fonts to improve interface aesthetics and brand recognition.
These templates provide companies and organizations with a powerful tool to present complex data sets in an intuitive and dynamic way, helping decision makers gain insight into critical information and make more informed decisions. Whether it's government agencies, financial institutions, retailers or medical organizations, you can find visual solutions that suit your needs.